50 Years Of the Bradley Siderograph
Written in 2009
Dear Friends and Readers of Rosecast,
In this free Financial Astrology Newsletter I want to once again talk about the Bradley Indicator and I will also - as promised - elaborate on the current financial crisis and my astrological view point on it and compare it with the period of the last severe crisis, the Great Depression of 1929 - 1932.
Lets start off with the Bradley. My astrologcial colleague from Vienna, Manfred Zimmel of Amanita Market Forecasting has just came out with a study that he has conducted on the Bradley Siderograph. And of course I was interested to see what he had to say, since I have created a fine piece of software to calculate the Bradley - the Rosecast Bradley software, a software that gives its users options beyond the original Bradley formula to include the advances of modern astrology.
The Bradley Correlates to Financial Commodities and the Stock Market
One thing that Manfred has noticed is that the Bradley has correlated higher with Crude Oil and the USD (he talks about the currencies, I use the USD Index as a measure of currencies) than with the stock market. Of course Manfred was referring only to the original Bradley and not the Rosecast Bradley, my own modification of the Bradley formula. This is what I have found: The original Bradley will correlate not higher with the stock market than the Rosecast Bradley. By using both models more turning points in the stock market can be called. For example the original Bradley has forecasted a strong turn for December 16, 2008 and the Rosecast Bradley for January 6, 2009.
The fact that the Bradley will also correlate with significant turns in other financial commodities (as Manfred has noticed) stems from the fact that the Bradley is NOT based on any individual horoscope (such a horoscope would be for example the birth date of the New York Stock Exchange). In fact the Bradley is solely based on the angles that the planets form at any moment in the skies. Therefore it is not surprising that the Bradley will correlate with other financial markets, too. My own recommendation when using the Rosecast Bradley software is this: Adjust the Rosecast Bradley in such a way that the last major high or low in the commodity or individual stock (share) that you are interested in, is called by the Bradley. Then use the same settings to forecast potential tuning points into the future.
Interesting Findings on the Long Term Lows in the Bradley Siderograph
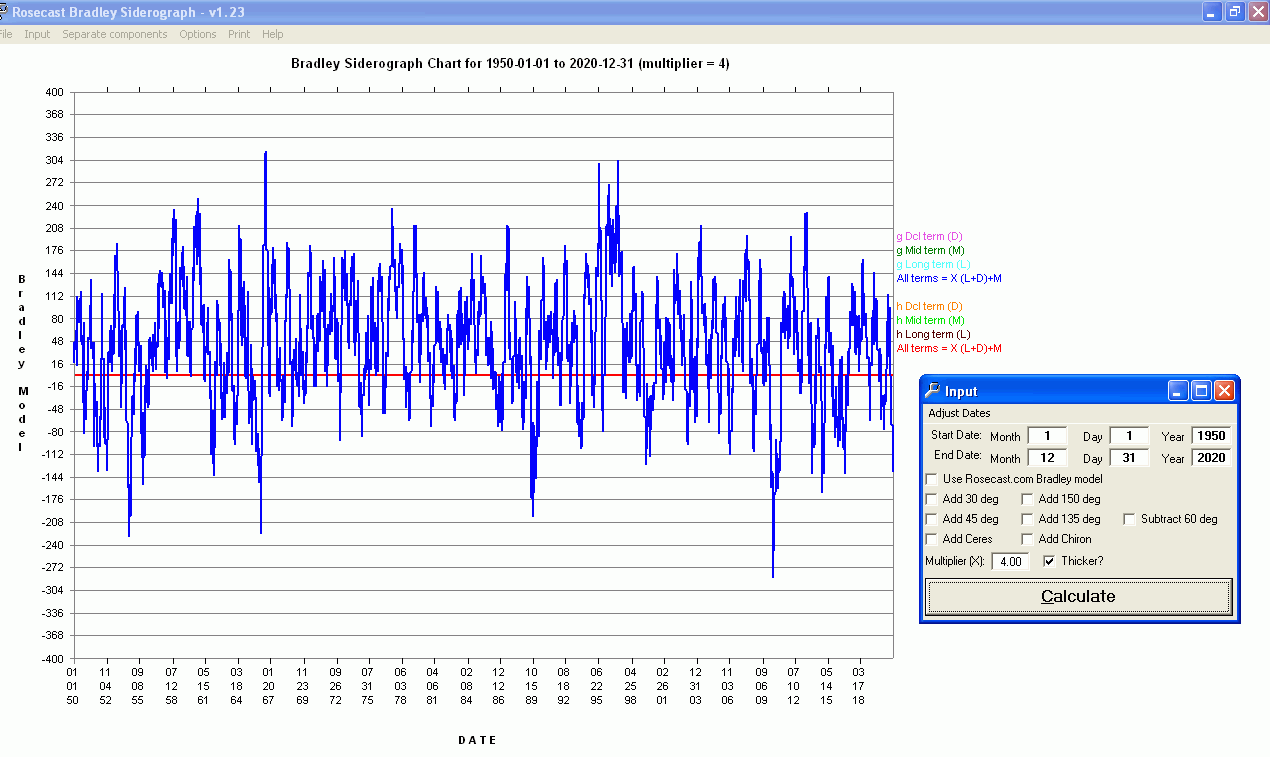
Last but not least Manfred also conducted a Long Term calculation of The Bradley and noted that the most significant absolute lows in the Bradley Siderograph occurred in the years 1871, 1931 and 2010. - "Wow", I think that is really an interesting finding - and I can confirm his results by using the Rosecast Bradley software (see below). In my own opinion the Bradley delivers indeed a correlation between the great crises of 1871 and 1931 and the current financial crisis. Therefore I conclude that at least according to this correlation of the original Bradley Siderograph: THE FINANCIAL CRISIS IS NOT OVER, BUT WILL CONTINUE INTO 2010. Again, this is my own conclusion. Below find the long term data calculated with the Rosecast Bradley:

As you see between 1950 and 2020, the year 2010 (the exact date (day, month year) will appear by choosing a time period of 1 year or less) gives the lowest Bradley value for a period of 70 years!!!
http://www.rosecast.com/powerof2010.htm click this, for more free information on the Bradley Siderograph!
Inflation versus Deflation
Many financial astrologers and market analysts have concluded that due to DEFICIT SPENDING by the Obama administration, the value of the Dollar will decrease. This will in turn lead towards a rampant kind of inflation that will ultimately drive stock prices higher - despite the poor economic facts of 2009 and the poor economic outlook.
I strongly disagree with these astrologers and analysts. To the contrary, the stars and planets are telling me that the current inflationary tendencies will soon subside and that money and credit will be short again - - like it has been in every other severe financial crisis. And this scenario is closer to deflation than to inflation.
In the next free Rosecast newletter I will introduce a new software called Rosecast Scientific and I will use this software to calculate Trispects so that I can get a better idea of locating the triggers of the current financial crisis in time. The concept of the Trispect can be applied to both long and short term market movements and it is also the key towards forecasting individual days in the stock market - a main focous of the Rosecast Classic and Market Timing subscriptions.
With heavenly regards,


