Perform
PERFORMANCE OF ROSECAST MARKET TIMING
PERFORMANCE OF ROSECAST MARKET SIGNALS
We have made many outstanding market calls during the last few months since we called the October 15, 2014 US-Indices lows within a few minutes.
Some of these calls are featured in the 2015 and 2016 Annual Forecasts, most of these calls in our Daily and Weekly member publications.
In March of 2016 we have made a fundamental discovery about Bond prices that helped us to improve our calls on the stock market.
As a result of this discovery we have published a Daily Stock Market Forecast since the beginning of the Astrological Year 2016 on March 21 in our weekly released RMT newsletter. We also have published a Trade of the Week. Post Predictions made each weekend capture the PERFORMANCE of our weekly updates.
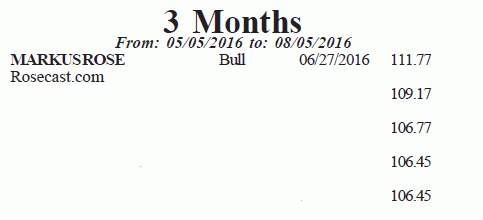
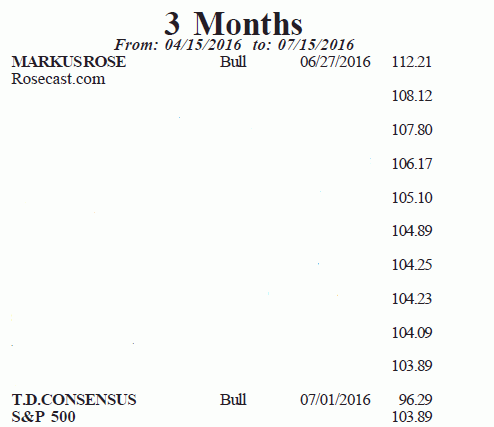
Breaking News From "Timer Digest": Rosecast.com ranked # 1 among 100+ worldwide market timers for most recent periods April - July 2016, May - August 2016


Find our "Daily Calls" and "Trades of the Week" since March 21, 2016 BELOW:
Notice that predictions for Mondays are already given on the weekend 7 days prior to Mondays.
For example the prediction for a down-day on June 27 was already made on June 19 in RMT CW 25 -
and not on June 26 when the update for CW 26 was released.
Correct Predictions are highlighted in BLUE, Wrong Predictions in RED, Neutral Predictions in BLACK
As you can see - our Daily predictions are more than 75% correct, particularly for those days with 2 digit gains or losses in S&P 500 Index.
Why it is important to be wrong, albeit less than 20% of the time ? This allows us to learn from our mistakes and improve our performance for the future.
The actual result is presented in CAPITAL LETTERS (UP, DOWN, UNCHANGED, the prediction in small letters before the result!)
EXAMPLE OF MOST ACCURATE S&P 500 (ES) 24-HOUR TIMING PREDICTIONS (All Times Are ET, USA) MADE 7 DAYS IN ADVANCE
Wednesday July 20
before going into the smaller time frames, I see already on the big picture that this day is likely to be UP, potentially up very strongly, particularly after 9h30 am, ET. 1 am is a potential low and change of trend. 1 am to 6 am is very bullish. 6 am to 9h00 am looks more bearish. But after 9ham or 9h30 am or 9h45 am AT THE LATEST a very STRONG rally will start and the rally will go on until 2 pm. Not sure after 2 pm, but I do not see any strong decline until 4 pm.
Overall this day is CLEARLY rated UP.
6h30 pm might give us a low. 10h45 pm is another potential time for a low. This means that it is best to exit longs on the close of July 20 at the latest. But also the period between 0 am and 3 am on Thursday looks more bearish.
Thursday July 21
the time between 0 am and 5 am looks bearish. But 5 am is a very important low...
PERFORMANCE FOR "TRADES OF THE WEEK" (March 21, 2016 - July 23, 2016) IN S&P 500 POINTS:
+3 -2 + 30 + 98 + 76 + 5 + 23 - 2 - 44 + 12 + 16 + 23 +8 + 17 + 19 + 12 = AVERAGE GAIN: 301 S&P points!
Become Member and JOIN the most accurate stock market predictions worldwide - www.asmaja.com
TRADE OF WEEK ? INTRADAY PREDICTIONS WITH TIMES ? Join US and become member at www.asmaja.com, www.rosecast.com/neworder.htm,
UP & DOWN - CW 29, 2016
July 18 up - DOWN
July 19 down (or neutral) - UP
July 20 up strongly - UP
July 21 up (until 12h55 pm) - DOWN
July 22 neutral
Trade of Week - CW 29, 2016
19) Buy S&P 500 on July 20 at 1 am (2157 ES) , sell on July 21 at 12h55 pm (2160 ES). AVERAGE GAIN 3 points
UP & DOWN - CW 28, 2016
July 11 up - UP
July 12 down (might be neutral) - UP
July 13 down - NEUTRAL
July 14 down (but rally late in the day) - DOWN
July 15 up - DOWN
Trade of Week - CW 28, 2016
18) Buy S&P 500 on close of July 14 at 14.45 pm , sell on close of July 15. AVERAGE LOSS 2 points
UP & DOWN - CW 27, 2016
July 5 down - DOWN
July 6 neutral - UP
July 7 neutral - DOWN
July 8 up - UP
Trade of Week - CW 27, 2016
17) Buy S&P 500 on July 7 at 12 pm , sell on close of July 8. AVERAGE GAIN 30 points
UP & DOWN - CW 26, 2016
June 27 down - DOWN
June 28 up - UP
June 29 up - UP
June 30 up - UP
July 1 down - UP
Trade of Week - CW 26, 2016
16) Buy S&P 500 on close of June 27, sell on close of June 30. AVERAGE GAIN 98 points
UP & DOWN - CW 25, 2016
June 20 neutral UP
June 21 down UP
June 22 up or neutral Down later changed to DOWN in Special Alert - Alerts (intraday-timing predictions) are e-mailed to members during week, if warranted.
June 23 down UP
June 24 down DOWN
Trade of Week - CW 25, 2016
15) Sell S&P 500 on close of June 23, buy back on close of June 24. AVERAGE GAIN 76 points
UP & DOWN - CW 24, 2016
June 13 "neutral (or down)" DOWN
June 14 "UP (or Neutral)" DOWN
June 15 down DOWN
June 16 down UP but notice that this was day has recorded the low of the week.
June 17 down DOWN
Trade of Week - CW 24, 2016
14) Sell S&P 500 at 1 pm, ET on June 14, buy back on close of June 17. AVERAGE GAIN 5 points
UP & DOWN - CW 23, 2016
June 6 "down - not sure" UP
June 7 neutral UP
June 8 up UP
June 9 down DOWN
June 10 down DOWN
Trade of Week - CW 23, 2016
14) Sell S&P 500 at the time of our aspect of the week (night of June 8) or on June 8 close. Buy back on June 10 close. AVERAGE GAIN 23 points
UP & DOWN - CW 22, 2016
May 30 Memorial Day - US Holiday
May 31 down DOWN
Jun 1 down - most sure - UP but low of June 1 12 points lower than previous close
Jun 2 down - UP
Jun 3 neutral - DOWN
Trade of Week - CW 22, 2016
13) Sell on close May 31st, buy back on close June 1. AVERAGE LOSS 2 points
UP & DOWN - CW 21, 2016
May 23 down DOWN
May 24 neutral UP
May 25 down UP
May 26 neutral UNCHANGED
May 27 up UP
Trade of Week - CW 21, 2016
12) Sell S&P 500 on Monday, May 23, 2016 early in the day, hold until Thursday, May 26 early in the day.
2048 may 23 - 2076 May 24 close - Exit with loss ("Cut losses, let profits Run"): AVERAGE LOSS 28 points or 44 points, if exit on May 26.
UP & DOWN - CW 20, 2016
May 16 up UP
May 17 neutral DOWN
May 18 down UNCHANGED
May 19 down DOWN
May 20 down UP higher opening YES "This day looks much better than the previous day, particularly the opening. Now the Moon is
conjunct to the midpoint of Jupiter and Pluto. Both planets are still within orb of a Trine aspect (a bullish pairing for stocks). This is suggesting that market might rally from lows between 3 and 3h30pm, ET on Thursday - all the way up into the opening at 9h30am, ET on Friday."
Trade of Week - CW 20, 2016
11) Sell S&P 500 on close of May 17. Hold short until May 19 at 3h pm, ET. AVERAGE GAIN 12 points
UP & DOWN - CW 19, 2016
May 9 neutral UP UNCHANGED
May 10 down - but likely UP until 12 pm YES UP
May 11 down - DOWN
May 12 down - DOWN
May 13 up - DOWN
Trade of Week - CW 19, 2016
10) Sell S&P 500 on May 10, preferably between 11 am and 1 pm, ET -if we get a bit of a rally into
this time frame. Hold short until late in the day on May 12. (2080 May 10 - 2064 May 12) AVERAGE GAIN 16 points
UP & DOWN - CW 18, 2016
May 2 down UP
May 3 "up preferred - not sure - risk no money on it"- DOWN
May 4 down DOWN
May 5 down DOWN
May 6 down UP caution rally in afternoon is sure -YES
Trade of Week - CW 18, 2016
9) Sell S&P 500 on May 4, if we get good rally on this day until 12 pm - not triggered AVERAGE GAIN 0 points
UP & DOWN - CW 17, 2016
Apr 25 up - BUT low is likely to occur between 8am and 9h30am, ET YES - DOWN
Apr 26 up - UP
Apr 27 up - UP
Apr 28 down - DOWN
Apr 29 down - DOWN
Trade of Week - CW 17, 2016
8) Trade of week: Sell low of Apr 27 …on stop for Apr 28 and 29. 2082 - 2065- 2052 - AVERAGE GAIN 23 points
UP & DOWN - CW 16, 2016
Apr 18 down UP
Apr 19 up UP
Apr 20 up UP
Apr 21 down DOWN
Apr 22 up UNCHANGED
Trade of Week - CW 16, 2016
7) Trade of week: Buy Apr 18 high, sell Apr 20 close 2094 - 2102 AVERAGE GAIN 8 points
UP & DOWN - CW 15, 2016
Apr 11 down DOWN
Apr 12 up preferred UP
Apr 13 up UP
Apr 14 down UNCHANGED
Apr 15 down DOWN
Trade of Week - CW 15, 2016
6) Sell the low of April 13 for April 14 on stop - not triggered AVERAGE GAIN 0 points
UP & DOWN - CW 14, 2016
April 4 down preferred DOWN
Apr 5 down DOWN
Apr 6 down UP
Apr 7 down preferred DOWN
Apr 8 up UP
Trade of Week - CW 14, 2016
4) Sell the morning low on April 5 on stop after 12 pm - not triggered AVERAGE GAIN 0 points
5) Sell the April 4 low on stop - 2062 Apr 4 low - 2045 April 5 close AVERAGE GAIN 17 points
UP & DOWN - CW 13, 2016
March 29 "up preferred" UP
March 30 "down likely" UP
March 31 down DOWN
Apr 1 up UP
Trade of Week - CW 13, 2016
3) Sell March 29 low on stop for March 30…stop was never triggered - AVERAGE GAIN 0 points
UP & DOWN - CW 12, 2016
Mar 21 "down -not sure" UP
Mar 22 "not sure"
Mar 23 "down - very likely" DOWN
March 24 "most important energy date, low of week" YES
March 28 "up" UP
Trade of Week - CW 12, 2016
1) Sell March 22 low on stop to take advantage of down on March 23 and 24 - YES 2040 on stop - 2022 - 2035 on March 24: AVERAGE GAIN 12 points
2) Buy March 24 high on stop YES 2036 -2055 AVERAGE GAIN 19 points
March 21, 2016 Beginning of Astrological Year 2016 - Start of New Performance Measurements


