THE TRISPECT REVISITED
Dear Clients, Prospects and Friends - Rosecast Financial Astrology Newsletter
Released in September of 2006
If you have not read the original Rosecast newsletter on the TRISPECT, you can do so online at www.rosecast.com/trispect.htm
Since the last publication of the Rosecast newsletter, I have received a lot of positive feedback regarding the TRISPECT. However some have also raised critical questions. After some discussion it has turned out that the strongest criticism was voiced by those who had the least understanding of how a TRISPECT is formed and when it would peak.
The main objection against the TRISPECT has been the following: "Since I have allowed a wide orb in the definition, there would be "too many TRISPECTs", in order for it to be of any practical use.
Those critics forget that, NO MATTER how wide an ORB (the inaccuracy or widest difference from a defined angle/aspect) is used, ANY TRISPECT (like any ASPECT for that matter) can only PEAK (in other jargon: BECOME EXACT) on a CERTAIN day, not on the DAY(S) BEFORE, and not on the DAY(S) AFTER.
The ORB in my definition has been used to distinguish a TRISPECT from an ASPECTED MIDPOINT. Also a smaller orb of 6 degrees for the Ptolemaic Aspects, and 3 degrees for all other aspects mentioned, will not change the significance of the TRISPECT. It will make it even more apparent to TRISPECT skeptics. For matters of market timing, the ORB does not matter, since we are only interested in when a TRISPECT WILL PEAK.
To illustrate the concept of "PEAKING" I have again chosen the example of March 12, 2003. As a picture tells more than a thousand words, I have drawn three graphics with Rosecast Astro - displaying the position of the TRISPECT planets for March 11, March 12 and March 13, 2003. After clicking HERE (link to www.rosecast.com/trispect2.htm), it should become obvious why the Rosecast TRISPECT between the Sun, Saturn and Pluto has only PEAKED on March 12 and not on March 11 or March 13. After visiting the above link, I hope you will agree with me that the TRISPECT is a valuable aid for matters of market timing - at least to the knowledgeable financial astrologer.
To all others (especially to beginning students), I have revealed the TRISPECT to prevent them from falling into what I call the "ASPECT TRAP". Proponets of the "ASPECT TRAP" will want to make you believe that a serious astrologer needs to know the statistical outcome of any planetary aspect in order to cast an informed forecast. In my opinion, this is the biggest nonsense ever publicized in financial astrology. And this is my answer to those promoting this nonsense:
"Any TRISPECT peaking is more important than any ASPECT peaking for matters of market timing and (financial) astrology". This is the message of the Rosecast TRISPECT newsletter to the world and to aspiring students of (financial) astrology. Statistical research on two planets, even if methodically valid, cannot be trusted for matters of market timing - as two planets do not exist in a vacuum. The TRISPECT is just one way to illustrate this.
Since Rosecast has long known the TRISPECT and related concepts, it is no wonder that Rosecast has often been calling market lows and highs to the exact day. Other financial astrologers talk about a time span from six trading days to several weeks during which to expect a market top or bottom.
On August 18, 2006 (Friday before last weekend) both the Dow Jones and the S&P 500 Indices have closed at their highs of the day. Conventional wisdom tells that if a market closes at its high of the day, it might be overbought.
Now here is what I did to analyze this high.
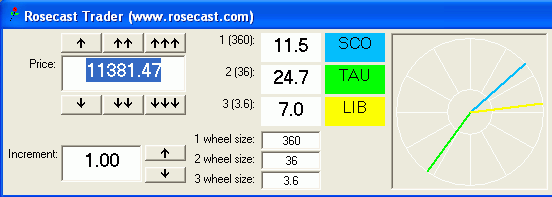
I have looked at the high/closing price of the Dow Jones Index. My trading software shows me 11381.47. Next I open the Rosecast Trader software with a mouse click (Rosecast Trader has been designed to open itself in less than a second and to use very little computer memory) and enter 11381.47 into the software. Below is a screen-shot of the result :
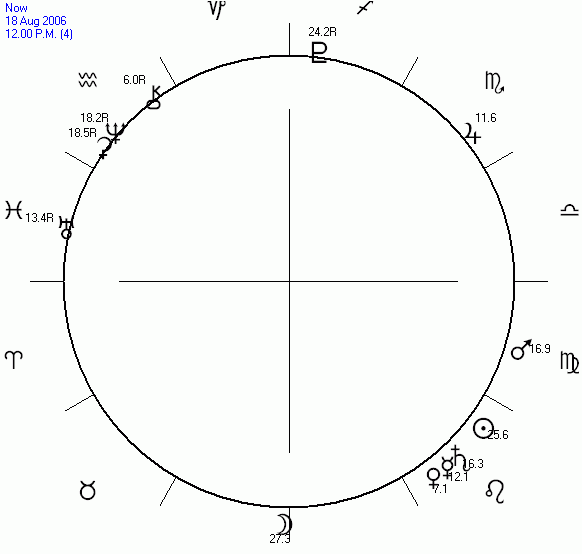
On the standard scale of 360 (any circle has 360 degrees) 11381.47 corresponds to a Zodiacal position of 11.5 Scorpio. Next I look at an Ephemeris - this is a book that lists the positions of the planets in the sky for each and every day. You can also use any astrology software for that purpose or consult a free page on the web that lists such data. Here is the result: Time zone is Eastern Time, Time is 12:00 pm (Noon):

As you see the position of Jupiter is 11.6 Scorpio for 12 pm (for 4 pm - market close - the rounded position of Jupiter would be 11.7 Scorpio, but since most Ephemeris books only list the Noon or Midnight positions, I have done the same here).

Screen above: Moving Stars Software
Now here is the striking result. The High and Closing Price of the Dow Jones Index for August 18 corresponded to the position of Jupiter with an inaccuracy of less than 0.20 Dow Points. Since the Dow Jones has an average range of between 50 to 100 points, an accuracy of 0.2 points (or 1/5000 of 00 points) is quite significant. Even the strongest of skeptics will agree to that.
Even more so as since more than 5000 years Jupiter is known as the planet of good fortune by practicing astrologers around he world. While there exist three major systems of astrology (the Chinese, the Vedic/Hindu and the Western) across different cultures, all three agree to the fact that Jupiter symbolizes good fortune. Talking about financial markets, Jupiter is known as the Bull, while Saturn is known as the Bear.
It is therefore not surprising to find the position of Jupiter corresponding to high prices of stocks and commodities and the position of Saturn corresponding to low prices of stocks and commodities. And whenever this happens with a great accuracy as in the example above, the market has an extremely high probability of 90% and higher (depending on the actual accuracy) to decline after meeting Jupiter at a high and to rise after meeting Saturn at a low.
You might wonder why there are three different wheel sizes in the Rosecast Trader screen-shot? The answer is simple: Rosecast Trader has been designed to work with all tradable instruments, be it bonds, currencies, commodities or stocks.
If you would track a stock or option with a yearly price range of 1.25$ to 2.25$ it would not make sense to use a 360 setting for that stock as this will always yield a Zodiacal position of 1.25 Aries to 2.25 Aries on a 360 wheel size. Therefore you would enter 3.6 or even 0.36 in the wheel size boxes, depending on the statistical accuracy that you are looking for.
Rosecast Trader has three different wheel sizes displayed at the same time, so that you can track three different groups of stocks, commodities or currencies without having to change wheel size settings every time you look at a different group. On closing and reopening the program, Rosecast Trader will automatically remember your settings from the last session.
You can learn more about Rosecast Trader by clicking here or visiting the SERVICES page at www.rosecast.com. Distribution of Rosecast Trader is limited to 100 copies, 50 copies have gone so far. All purchasers of Rosecast Trader will receive a rebate on the public version of Rosecast Astro which will be released in 2007. Rosecast Astro is designed to open the world of astrology and financial astrology to anybody with good common sense, but with no knowledge of astrology whatsoever. At the same time it will contain unique features - just like Rosecast Trader has - not available anywhere else today.


