TRADING THE S&P 500
Trading the S&P 500
Written in January of 2004
Converting Planets to Price
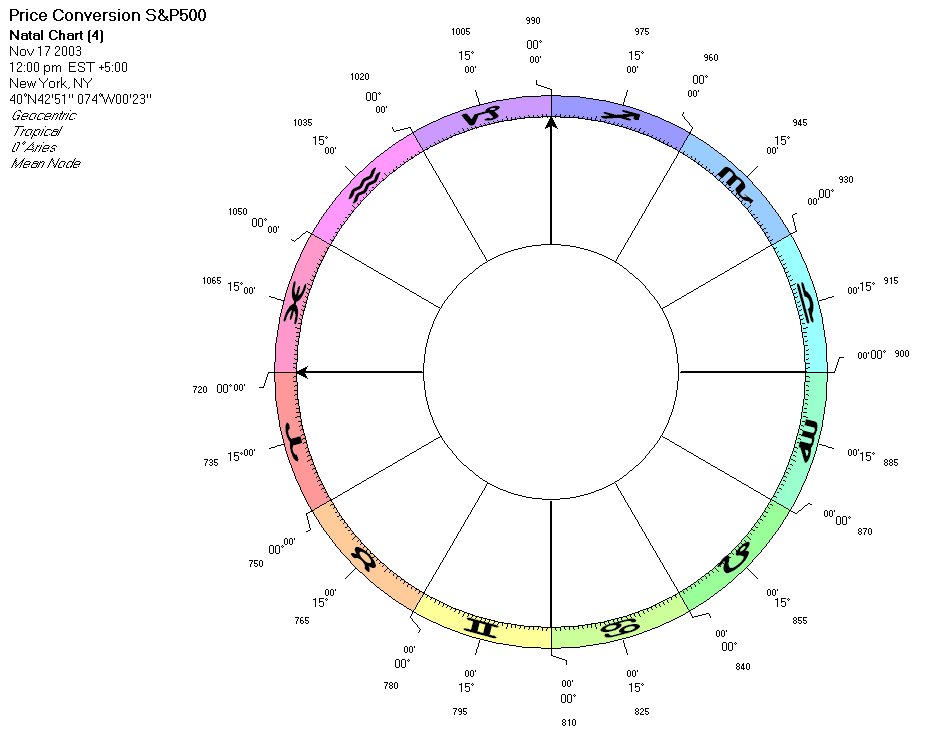
A circle has 360 degree. This is based on the ancient astrologers observing that the Sun was approximately moving one degree a day or 360 degrees a year to return to its position in the zodiac. Thus a price of 360 in a stock or commodity converts to the position of 0 degree Aries (arrow pointing westwards on the circle below). So does a price of 720 and 1080 - as these numbers are 2 and 3 times 360, respectively. The wheel below shows the price conversion for the price range of 720 to 1080 for the S&P.
So each price segment of 360 completes a circle. And every multiple of 90 points is a quarter circle (arrows in the graph below). Thus 990 and 1080 are natural resistance point. But you could also make the assumption that 36 (square of 6 ) points (for day trading) or 3600 points (for weekly and monthly charts) complete a circle. In the former case every price multiple of 9 will complete a quarter circle. Astrologically speaking every quarter circle represents an ingress into a cardinal sign, or the change of a season, if you relate the circle to a calendar year. What does this mean ? We have now derived from astrology that every price that can be divided by 9 will be significant for the purpose of day-trading. Gann's famous square of 9 is just based on this knowledge.
However while Gann would teach the square of 9 to his ordinary students, he would teach in his most advanced courses the relation of the square to the planets in the sky.
Aries 0 points on a scale of 36: ...,720, 756, 792, 828, 864, 900, 936, 972, 1008, 1044, 1080, 1116, 1152, 1188, 1224, 1260, 1296, 1332, 1368, 1404, 1440, 1476, 1512, 1548, 1584,....these are natural resistance points.
Aries 0 points on a scale of 360: 360, 720, 1080, 1440, 1800, 2160, 2520, 2880, 3240, 3600, 3960, 4320, 4680, 5040, 5400, 5760, 6120, 6480, 6840, 7200, 7560, 7920, 8280, 8640, 9000, 9360, 9720, 10080, 10440, 10800, 11160, 11520, 11880,...
Cardinal Ingress points on a scale of 360: 90, 180, 270, 360, 450, 540, 630, 720, 810, 900, 990, 1080, 1170, 1260, 1350, 1440, 1530, 1620,.......these are natural resistance points.
The wheel chart below has been created with Solar Fire 5 and depicts the 360 scale.


The above graph has been produced with the Fibonacci/Galactic Trader Software !
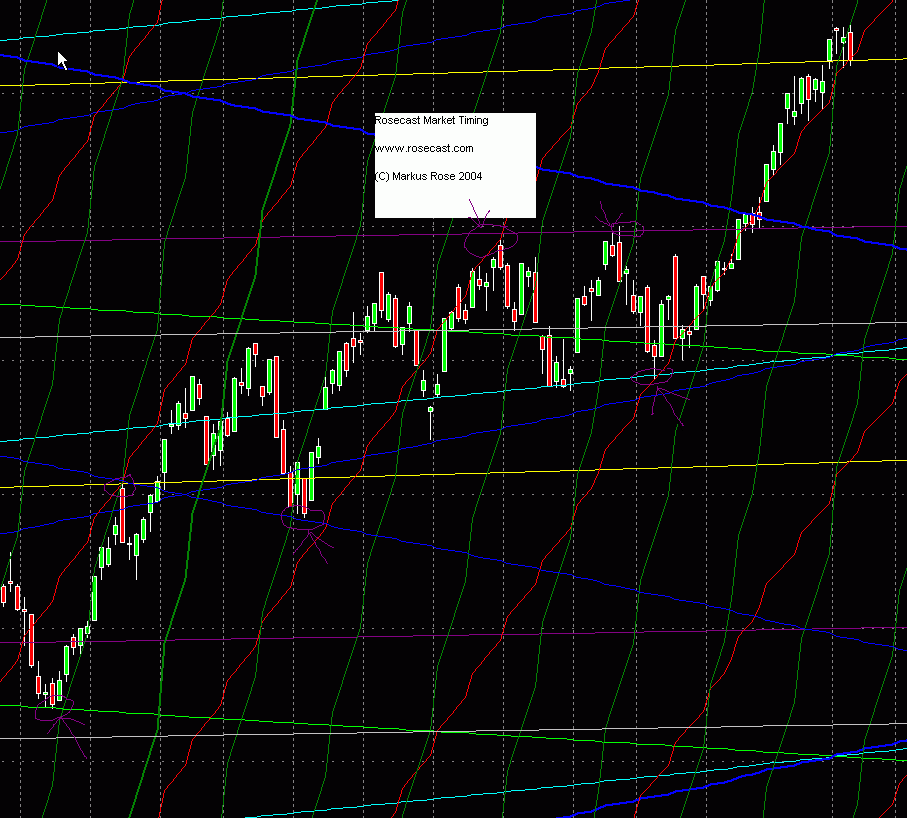
Above price chart: NASDAQ Composite, DAILY CANDLESTICK, between July 30, 2003 and January 22, 2004
Let the market be your guide
Above I have shown a DAILY chart of the NASDAQ Composite index and I have applied heliocentric astrology to guide me around the most important turning points that I have circled in "violet" and market with an arrow. All circles in the above picture have as their focus the crossing of two lines.
In this picture every colored line represent the movement of a planet. The red line represents the planet Mars. From the time (December 10, 2003) that the red planet Mars line has crossed the light blue planet Saturn line, the red line was leading the NASDAQ up until now. What will take it take for the NASDAQ to move away from the red line?
I would suggest that a crossing of the red line with another planet line could do it. But the crossings so far - the violet line Pluto - and the yellow line Uranus - have turned out at the bottom of daily bars/candles rather than at the top and thus provided continued support to the NASDAQ instead of resistance.
Chiron - the light green line , Venus - the dark green line and Jupiter - the dark blue line provided additional support and resistance in the above chart to the NASDAQ but only when those lines crossed each other.
Any crossing of two differently colored lines represents an aspect. Aspects usually have a duration of three days before and after the aspect. Astrologers say that the orb of the aspects is three days or three degrees. If you look now at the points I circled on the chart, you might notice that every time there is an aspect something happens depending on whether the approximate crossing of the lines occurs at the high of the bar (planetary resist) or low of the bar (planetary support).
Is this particular aspect bearish or bullish ?
Financial traders that are learning astrology usually start by investing a lot of time and money to find out whether an upcoming planetary aspect will have a bullish or a bearish effect on a particular market.
Unfortunately statistical models based on past price history are not reliable in this matter because of an astrological law that only a few master astrologers know. This is unfortunate, as a lot of wrong predictions made by professional astrologers today, are caused by the ignorance of this law.
I am going to reveal this important scientific law now to you. This law is called the theorem of planetary aspect transformation and was to my knowledge first introduced by the Magi Society on page 34 of their excellent book "The Magi Society Ephemeris Including Secrets of Magi Astrology", published by Hay House in 1997. The theorem states that whenever there is an aspect between two planets, the nature of that aspect is TRANSFORMED by any other planet that is making an aspect to the planets comprising the original aspect. Thus only when you consider ALL the planets in a horoscope will you be able to reveal the nature (bullish or bearish) of a particular aspect. But just to do this is the most difficult task in astrological forecasting as two alignments are never the same.
Because of the theorem of aspect transformation any program that claims to find out the nature of a particular aspect based on its relation to past market data has to be used with utmost care in financial astrology.
But luckily there is a more effective and simpler method to successfully trading the market and using astrology effectively.
Instead of trying to predict how a particular aspect will effect a particular market, why not let the market decide whether any particular aspect will be bearish or bullish?
If an aspect comes out at the low of the daily bar it will be a bullish sign for the near future of that market and if it comes out at the high of a bar it will be a bearish sign. It is that simple. No need to second guess the market.
Once you know how to judge a market based on converting a planetary aspect to price, you can uncover hidden support and resistance areas of any stock or commodity and use that knowledge to find a low risk high reward trading opportunity.
(C) 2004, www.rosecast.com


